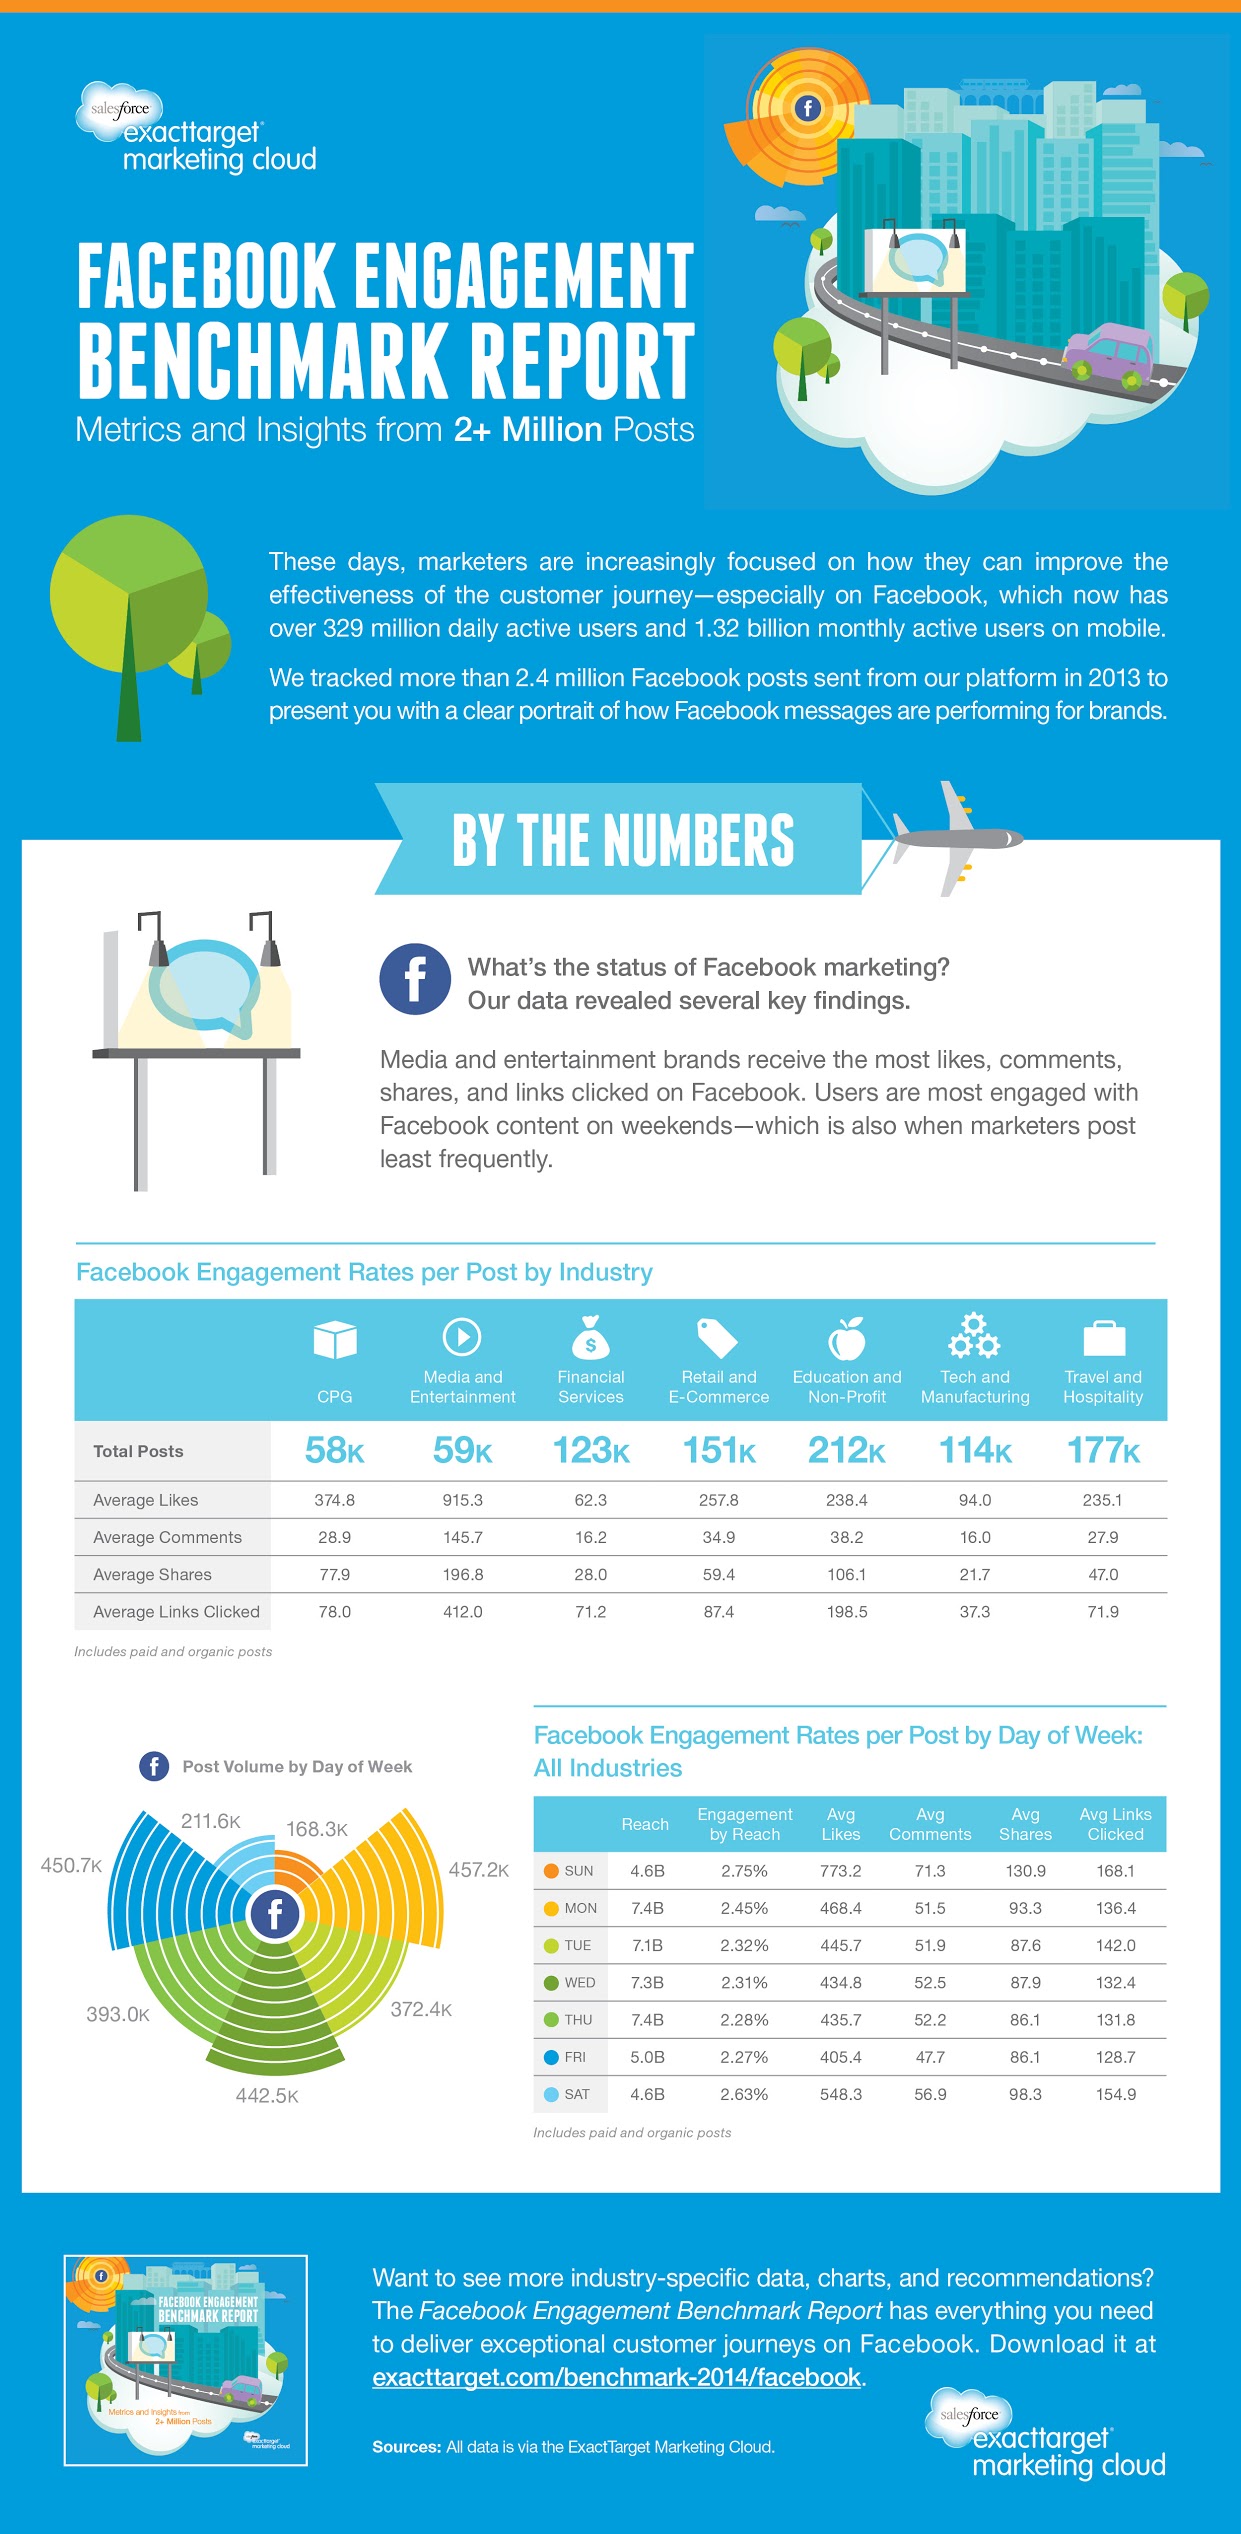
Including some very surprising truths about weekend Facebook engagement rates, Salesforce has delivered report measuring Facebook engagement rates – using a pool of 2.4 million posts. It’s interesting to note that Salesforce analyzed 59k Media and Entertainment posts, while they had 2-4x the data to work with in many other industries (212k Education and Non-Profit posts, 177k Travel and Hospitality posts, etc.). This could suggest that Media and Entertainment pages are seeing better engagement rates by posting less content.
As Marketers used to think of Weekdays with peak performance Tues. – Thurs. in the afternoons, the Facebook engagement data pulled from 2.4 million posts tells adifferent story. Sunday actually sees the most engagement by reach (2.75%), as well as the highest averages for Likes, Comments, Shares, and Links Clicked! This is likely attributed to very low reach (“low” being 4.6B, compared to 7.1B – 7.4B in the Mon. – Thurs. range).
- Average Likes Per Post: 374.8, Consumer Packaged Goods / 238.4, Education and Non-Profit
- Average Comments Per Post: 38.2, Education and Non-Profit / 34.9, Retail and E-Commerce
- Average Shares Per Post: 106.1, Education and Non-Profit / 77.9, Consumer Packaged Goods
- Average Links Clicked Per Post: 198.5, Education and Non-Profit / 87.4, Retail and E-Commerce
Source: http://thinkmarketingmagazine.com/index.php/facebook-engagement-benchmark-report-2014/


 MEWS is a full service web development Internet marketing company and technology integrator founded in 2003, by leading industry consultants with previous technology experience.MEWS is an Internet services and solutions company with interests in website development – Mobile applications– domain name registrations - web hosting.